New year, a new version of Huawei Network Simulation Platform eNSP has been released.
You can download it clicking on the below link:
New year, a new version of Huawei Network Simulation Platform eNSP has been released.
You can download it clicking on the below link:
When there are multiple routes to the same destination, BGP (Border Getaway Protocol) on Huawei devices:
The Multiple Spanning Tree Protocol (MSTP) was originally defined as the IEEE 802.1s standard protocol. Now the standard IEEE 802.1Q-2005 includes MSTP. The basic role of this protocol is to prevent L2 loops. I do not want to explain MSTP in details, as this can be easily found on the Internet. I just want to show you:
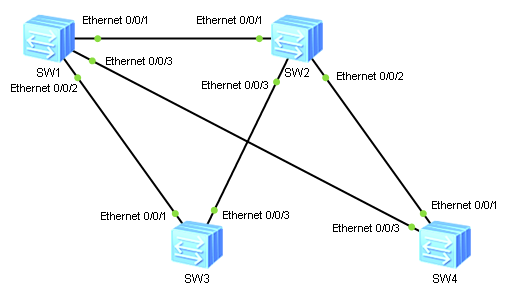
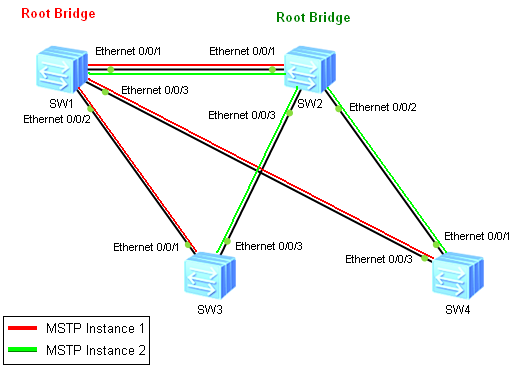
Let’s assume that we have the following physical topology:
By default MSTP runs only one spanning-tree topology over a LAN network for every VLAN. Even if we configure 1000 different VLANs throughout this topology, only three links will be utilized. This is because STP blocks two links, preventing our topology from L2 loops. In our case SW1 was elected as the Root Bridge. As a result we have the following logical topology which will be used by every VLAN to forward traffic (assuming default MSTP configuration):
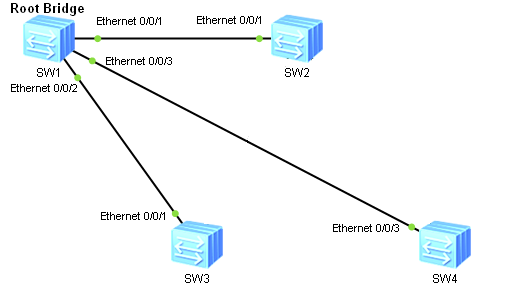
Links SW2—SW3 and SW2—SW4 will be blocked by the SW3 and SW4 switches respectively. Traffic from every device connected to any VLAN configured, will be travelling only these three links. This is a default MSTP behaviour.
To overcome this negative issue, MSTP protocol should be properly planned and configured. By default this protocol runs only one STP instance and maps all VLANs to this instance. To utilize all physical links equally, additional instances should be added.
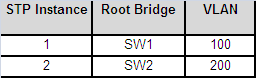
Let’s assume that we have two VLANs: 100 and 200. By default both VLANs will use the same logical STP topology as in the picture above. This is because both VLANs belong to the same MSTP Instance, which was determined by the one Root Bridge placement (SW1 in our case).
To force VLAN 100 to use one logical topology and VLAN 200 to use a different logical topology, we need to:
Please see table and the picture below:
Let’s start configuring our devices. As a first step all switches have to be configured with VLAN information (SW2-4 configuration omitted):
<labnarioSW1>system-view
[labnarioSW1]vlan batch 100 200
Now we can configure MSTP protocol (all switches have to be configured):
[labnarioSW1]stp region-configuration
[labnarioSW1-mst-region] region-name labnario
[labnarioSW1-mst-region] instance 1 vlan 100
[labnarioSW1-mst-region] instance 2 vlan 200
[labnarioSW1-mst-region] active region-configuration
Info: This operation may take a few seconds. Please wait for a moment....done.
[labnarioSW1-mst-region]
To check MSTP configuration:
[labnarioSW1-mst-region]check region-configuration
 Admin configuration
   Format selector    :0
   Region name        :labnario
   Revision level     :0

  Instance   VLANs Mapped
      0       1 to 99, 101 to 199, 201 to 4094
      1       100
      2       200
[labnarioSW1-mst-region]
As you see above, by default all VLANs are mapped to the MSTP Instance 0. This is the reason that all VLANs use the same logical topology to forward traffic between devices.
Now SW1 should be configured as the Root Bridge for MSTP Instance 1 and SW2 as the Root Bridge for MSTP Instance 2. In case of Root Bridge failure, backup devices should be also defined as follows:
[labnarioSW1]stp instance 1 root primary
[labnarioSW1]stp instance 2 root secondary

[labnarioSW2]stp instance 1 root secondary
[labnarioSW2]stp instance 2 root primary
Let’s check our MSTP configuration is working as we have planned:
[labnarioSW1]display stp instance 1
-------[MSTI 1 Global Info]-------
MSTI Bridge ID      :0.4c1f-cc10-af35
MSTI RegRoot/IRPC   :0.4c1f-cc10-af35 / 0
MSTI RootPortId     :0.0
MSTI Root Type      :Primary root
Master Bridge       :32768.4c1f-cc10-af35
Cost to Master      :0
TC received         :33
TC count per hello  :0
Time since last TC  :0 days 1h:46m:14s
Number of TC        :34
Last TC occurred    :Ethernet0/0/3
 ----[Port1(Ethernet0/0/1)][FORWARDING]----
 Port Role           :Designated Port
 Port Priority       :128
 Port Cost(Dot1T )   :Config=auto / Active=1
 Designated Bridge/Port   :0.4c1f-cc10-af35 / 128.1
 Port Times          :RemHops 20
 TC or TCN send      :16
 TC or TCN received  :10
 ----[Port2(Ethernet0/0/2)][FORWARDING]----
 Port Role           :Designated Port
 Port Priority       :128
 Port Cost(Dot1T )   :Config=auto / Active=1
 Designated Bridge/Port   :0.4c1f-cc10-af35 / 128.2
 Port Times          :RemHops 20
 TC or TCN send      :22
 TC or TCN received  :6
 ----[Port3(Ethernet0/0/3)][FORWARDING]----
 Port Role           :Designated Port
 Port Priority       :128
 Port Cost(Dot1T )   :Config=auto / Active=1
 Designated Bridge/Port   :0.4c1f-cc10-af35 / 128.3
 Port Times          :RemHops 20
 TC or TCN send      :3
 TC or TCN received  :3
[labnarioSW1]
As you can see, SW1 MSTP bridge ID is:
0.4c1f-cc10-af35
Zero followed by the MAC address means, that this switch is the Root Bridge Primary for the MSTP Instance 1. By default bridge priority equals to 32768. Let’s check MSTP Instance 2:
[labnarioSW1]display stp instance 2
-------[MSTI 2 Global Info]-------
MSTI Bridge ID      :4096.4c1f-cc10-af35
MSTI RegRoot/IRPC   :0.4c1f-cc60-2fd3 / 1
MSTI RootPortId     :128.1
MSTI Root Type      :Secondary root
Master Bridge       :32768.4c1f-cc10-af35
Cost to Master      :0
TC received         :30
TC count per hello  :0
Time since last TC  :0 days 1h:56m:51s
Number of TC        :34
Last TC occurred    :Ethernet0/0/1
 ----[Port1(Ethernet0/0/1)][FORWARDING]----
 Port Role           :Root Port
 Port Priority       :128
 Port Cost(Dot1T )   :Config=auto / Active=1
 Designated Bridge/Port   :0.4c1f-cc60-2fd3 / 128.1
 Port Times          :RemHops 20
 TC or TCN send      :11
 TC or TCN received  :12
 ----[Port2(Ethernet0/0/2)][FORWARDING]----
 Port Role           :Designated Port
 Port Priority       :128
 Port Cost(Dot1T )   :Config=auto / Active=1
 Designated Bridge/Port   :4096.4c1f-cc10-af35 / 128.2
 Port Times          :RemHops 19
 TC or TCN send      :15
 TC or TCN received  :7
 ----[Port3(Ethernet0/0/3)][FORWARDING]----
 Port Role           :Designated Port
 Port Priority       :128
 Port Cost(Dot1T )   :Config=auto / Active=1
 Designated Bridge/Port   :4096.4c1f-cc10-af35 / 128.3
 Port Times          :RemHops 19
 TC or TCN send      :5
 TC or TCN received  :0
[labnarioSW1]
Bridge ID is:
4096.4c1f-cc10-af35
Bridge priority equals to 4096, this is because this switch is configured as the Root Bridge Secondary for the MSTP Instance 2.
Look at the field:
MSTI RegRoot/IRPC :0.4c1f-cc60-2fd3
As you see, RegRoot ID is different than Bridge ID. This is because SW2 was configured as the STP Root Bridge Primary for the MSTP Instance 2.
Let’s check STP port roles and states:
[labnarioSW1]display stp brief
 MSTID  Port                        Role  STP State     Protection
   0    Ethernet0/0/1               DESI  FORWARDING      NONE
   0    Ethernet0/0/2               DESI  FORWARDING      NONE
   0    Ethernet0/0/3               DESI  FORWARDING      NONE
   1    Ethernet0/0/1               DESI  FORWARDING      NONE
   1    Ethernet0/0/2               DESI  FORWARDING      NONE
   1    Ethernet0/0/3               DESI  FORWARDING      NONE
   2    Ethernet0/0/1               ROOT  FORWARDING      NONE
   2    Ethernet0/0/2               DESI  FORWARDING      NONE
   2    Ethernet0/0/3               DESI  FORWARDING      NONE
[labnarioSW1]
All ports in MSTP Instance 1 have a Designated role. This means that SW1 is the Root Bridge for this Instance.
To check MSTP topology per VLAN, just type:
[labnarioSW1]display stp vlan 100
 ProcessId   InstanceId   Port                        Role  State
 ----------------------------------------------------------------------
    0            1        Ethernet0/0/1               DESI  FORWARDING
    0            1        Ethernet0/0/2               DESI  FORWARDING
    0            1        Ethernet0/0/3               DESI  FORWARDING
[labnarioSW1]display stp vlan 200
 ProcessId   InstanceId   Port                        Role  State
 ----------------------------------------------------------------------
    0            2        Ethernet0/0/1               ROOT  FORWARDING
    0            2        Ethernet0/0/2               DESI  FORWARDING
    0            2        Ethernet0/0/3               DESI  FORWARDING
[labnarioSW1]
The same verification commands on SW2:
[labnarioSW2]dis stp instance 1
-------[MSTI 1 Global Info]-------
MSTI Bridge ID      :4096.4c1f-cc60-2fd3
MSTI RegRoot/IRPC   :0.4c1f-cc10-af35 / 1
MSTI RootPortId     :128.1
MSTI Root Type      :Secondary root
Master Bridge       :32768.4c1f-cc10-af35
Cost to Master      :1
TC received         :47
TC count per hello  :0
Time since last TC  :0 days 2h:12m:1s
Number of TC        :40
Last TC occurred    :Ethernet0/0/1
 ----[Port1(Ethernet0/0/1)][FORWARDING]----
 Port Role           :Root Port
 Port Priority       :128
 Port Cost(Dot1T )   :Config=auto / Active=1
 Designated Bridge/Port   :0.4c1f-cc10-af35 / 128.1
 Port Times          :RemHops 20
 TC or TCN send      :10
 TC or TCN received  :16
 ----[Port2(Ethernet0/0/2)][FORWARDING]----
 Port Role           :Designated Port
 Port Priority       :128
 Port Cost(Dot1T )   :Config=auto / Active=1
 Designated Bridge/Port   :4096.4c1f-cc60-2fd3 / 128.2
 Port Times          :RemHops 19
 TC or TCN send      :32
 TC or TCN received  :14
 ----[Port3(Ethernet0/0/3)][FORWARDING]----
 Port Role           :Designated Port
 Port Priority       :128
 Port Cost(Dot1T )   :Config=auto / Active=1
 Designated Bridge/Port   :4096.4c1f-cc60-2fd3 / 128.3
 Port Times          :RemHops 19
 TC or TCN send      :9
 TC or TCN received  :0
[labnarioSW2]
RegRoot field points to SW1’s MAC address. This means that SW1 is the Root Bridge for MSTP Instance 1. Bridge ID followed by the 4096 means that SW2 is the Root Bridge Secondary for MSTP Instance 1.
Port roles and states:
[labnarioSW2]display stp brief
 MSTID  Port                        Role  STP State     Protection
   0    Ethernet0/0/1               ROOT  FORWARDING      NONE
   0    Ethernet0/0/2               ALTE  DISCARDING      NONE
   0    Ethernet0/0/3               DESI  FORWARDING      NONE
   1    Ethernet0/0/1               ROOT  FORWARDING      NONE
   1    Ethernet0/0/2               DESI  FORWARDING      NONE
   1    Ethernet0/0/3               DESI  FORWARDING      NONE
   2    Ethernet0/0/1               DESI  FORWARDING      NONE
   2    Ethernet0/0/2               DESI  FORWARDING      NONE
   2    Ethernet0/0/3               DESI  FORWARDING      NONE
[labnarioSW2]
All ports in MSTP Instance 2 have Designated role and Forwarding state. This switch is the Root Bridge for MSTP Instance 2.
STP port roles and states per VLAN:
[labnarioSW2]dis stp vlan 100
 ProcessId   InstanceId   Port                        Role  State
 ----------------------------------------------------------------------
    0            1        Ethernet0/0/1               ROOT  FORWARDING
    0            1        Ethernet0/0/2               DESI  FORWARDING
    0            1        Ethernet0/0/3               DESI  FORWARDING
[labnarioSW2]dis stp vlan 200
 ProcessId   InstanceId   Port                        Role  State
 ----------------------------------------------------------------------
    0            2        Ethernet0/0/1               DESI  FORWARDING
    0            2        Ethernet0/0/2               DESI  FORWARDING
    0            2        Ethernet0/0/3               DESI  FORWARDING
[labnarioSW2]
Which links are blocked by the MSTP? Lets check STP topologies on SW3:
[labnarioSW3]dis stp brief
 MSTID  Port                        Role  STP State     Protection
   0    Ethernet0/0/1               ROOT  FORWARDING      NONE
   0    Ethernet0/0/3               ALTE  DISCARDING      NONE
   1    Ethernet0/0/1               ROOT  FORWARDING      NONE
   1    Ethernet0/0/3               ALTE  DISCARDING      NONE
   2    Ethernet0/0/1               ALTE  DISCARDING      NONE
   2    Ethernet0/0/3               ROOT  FORWARDING      NONE
[labnarioSW3]
Interface Eth0/0/3 is blocked by the STP Instance 1 and Eth0/0/1 blocked by the STP Instance 2.
Which ports are blocked on the SW4?
[labnarioSW4]dis stp brief
 MSTID  Port                        Role  STP State     Protection
   0    Ethernet0/0/1               DESI  FORWARDING      NONE
   0    Ethernet0/0/3               ROOT  FORWARDING      NONE
   1    Ethernet0/0/1               ALTE  DISCARDING      NONE
   1    Ethernet0/0/3               ROOT  FORWARDING      NONE
   2    Ethernet0/0/1               ROOT  FORWARDING      NONE
   2    Ethernet0/0/3               ALTE  DISCARDING      NONE
[labnarioSW4]
In the MSTP Instance 1 Eth0/0/1 is blocked, and Eth0/0/3 in MSTP Instance 2.
MSTP debugging commands:
<labnarioSW4>debugging stp ?
  all           Specify all debug switch
  event         Specify event debug switch
  global-error  Specify global error debug switch
  global-event  Specify global event debug switch
  ha-info       Backup information
  instance      Spanning tree instance
  interface     Specify interface
  msti          Specify debugging packet's MSTIs
  packet        Specify packet debug switch
  process       The MSTP process
Read More »
GVRP stands for GARP VLAN Registration Protocol and is a GARP application that registers and deregisters VLAN attributes. It uses Generic Attribute Registration Protocol (GARP), to maintain and propagate dynamic VLAN registration information, throughout GVRP enabled devices on the network.
GVRP lets a device to propagate local VLAN registration information to other participant devices, and to dynamically update the VLAN registration information from other devices to its local database, including active VLAN members and through which port they can be reached. All GVRP participants on a bridged LAN maintain the same VLAN registration information. The VLAN registration information includes both manually configured local static entries and dynamic entries from other devices.
There are 3 different registration modes:
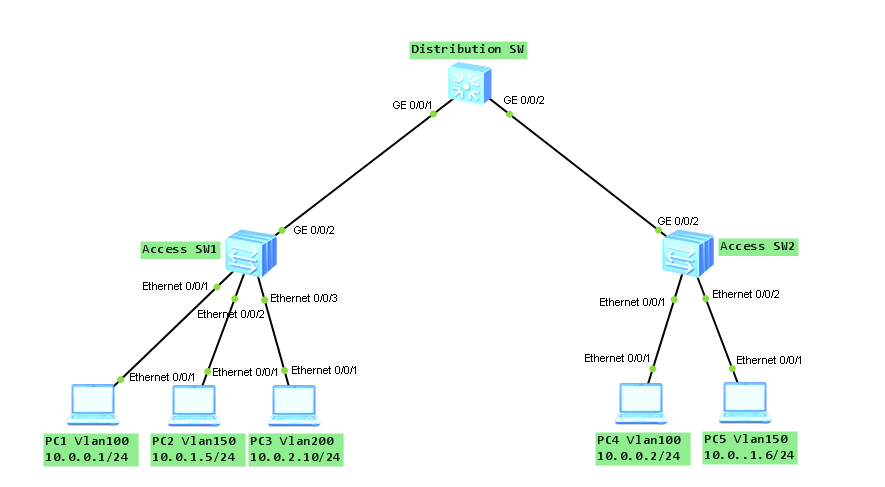
Let’s look at our topology. What we want to do is to check how GVRP works:
GARP identifies applications through destination MAC addresses. IEEE 802.1Q assigns 01-80-C2-00-00-21 to the VLAN application (GVRP):
![]()
Create VLANs 100, 150 and 200 on Access SW1 (configuration of Access SW2 is omitted here):
[Access SW1]vlan batch 100 150 200
Info: This operation may take a few seconds. Please wait for a moment...done.
[Access SW1]
Add Ethernet interfaces to proper VLANs:
[Access SW1]interface Ethernet0/0/1
[Access SW1-Ethernet0/0/1]port link-type access
[Access SW1-Ethernet0/0/1]port default vlan 100

[Access SW1]interface Ethernet0/0/2
[Access SW1-Ethernet0/0/2]port link-type access
[Access SW1-Ethernet0/0/2]port default vlan 150

[Access SW1]interface Ethernet0/0/3
[Access SW1-Ethernet0/0/3]port link-type access
[Access SW1-Ethernet0/0/3]port default vlan 200
Configure trunks between Access switches and Distribute switch and permit all VLANs to pass through (configuration of Distribution SW is omitted here):
[Access SW1]interface GigabitEthernet0/0/2
[Access SW1-GigabitEthernet0/0/2]port link-type trunk
[Access SW1-GigabitEthernet0/0/2]port trunk allow-pass vlan all
Enable GVRP globally on all switches:
[Access SW1]gvrp
Enable GVRP on all trunk interfaces in the network:
[Access SW1-GigabitEthernet0/0/2]gvrp
Verification:
[Access SW1]display vlan summary
static vlan:
Total 4 static vlan.
  1 100 150 200

dynamic vlan:
Total 0 dynamic vlan.

reserved vlan:
Total 0 reserved vlan.

[Access SW2]dis vlan sum
static vlan:
Total 3 static vlan.
  1 100 150

dynamic vlan:
Total 1 dynamic vlan.
  200

reserved vlan:
Total 0 reserved vlan.

[Distribution SW]display vlan summary
static vlan:
Total 1 static vlan.
  1

dynamic vlan:
Total 3 dynamic vlan.
  100 150 200

reserved vlan:
Total 0 reserved vlan.

PC1>ping 10.0.0.2

Ping 10.0.0.2: 32 data bytes, Press Ctrl_C to break
From 10.0.0.2: bytes=32 seq=1 ttl=128 time=63 ms
From 10.0.0.2: bytes=32 seq=2 ttl=128 time=62 ms
From 10.0.0.2: bytes=32 seq=3 ttl=128 time=62 ms
From 10.0.0.2: bytes=32 seq=4 ttl=128 time=47 ms
From 10.0.0.2: bytes=32 seq=5 ttl=128 time=47 ms

--- 10.0.0.2 ping statistics ---
  5 packet(s) transmitted
  5 packet(s) received
  0.00% packet loss
  round-trip min/avg/max = 47/56/63 ms

PC2>ping 10.0.1.6

Ping 10.0.1.6: 32 data bytes, Press Ctrl_C to break
From 10.0.1.6: bytes=32 seq=1 ttl=128 time=47 ms
From 10.0.1.6: bytes=32 seq=2 ttl=128 time=63 ms
From 10.0.1.6: bytes=32 seq=3 ttl=128 time=109 ms
From 10.0.1.6: bytes=32 seq=4 ttl=128 time=62 ms
From 10.0.1.6: bytes=32 seq=5 ttl=128 time=63 ms

--- 10.0.1.6 ping statistics ---
  5 packet(s) transmitted
  5 packet(s) received
  0.00% packet loss
  round-trip min/avg/max = 47/68/109 ms
Now configure GVRP registration mode as fixed on the trunk between Access SW1 and Distribution SW:
[Access SW1-GigabitEthernet0/0/2]gvrp registration fixed
[Distribution SW-GigabitEthernet0/0/1]gvrp registration fixed
[Distribution SW]display gvrp statistics

  GVRP statistics on port GigabitEthernet0/0/1
    GVRP status				: Enabled
    GVRP registrations failed		: 291
    GVRP last PDU origin		: 4c1f-cc46-e9ad
    GVRP registration type		: Fixed

  GVRP statistics on port GigabitEthernet0/0/2
    GVRP status				: Enabled
    GVRP registrations failed		: 0
    GVRP last PDU origin		: 4c1f-ccea-7bb8
    GVRP registration type		: Normal
Display VLANs on Distribution and Access SW2 switches:
[Distribution SW]display vlan sum
static vlan:
Total 1 static vlan.
  1

dynamic vlan:
Total 2 dynamic vlan.
  100 150

reserved vlan:
Total 0 reserved vlan.

[Access SW2]display vlan summary
static vlan:
Total 3 static vlan.
  1 100 150

dynamic vlan:
Total 0 dynamic vlan.

reserved vlan:
Total 0 reserved vlan.
As you can see VLAN 200 is not passing anymore.
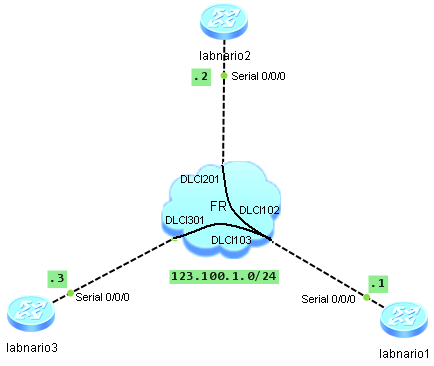
Read More »Let’s assume that we have a Frame Relay topology like in the picture below. We want to have full IP connectivity between our ‘labnario’ routers. To demonstrate, how to configure different types of Frame Relay interface, I will use:
Let’s start with labnario1 configuration.
<labnario1>system-view
[labnario1]interface Serial0/0/0
[labnario1-Serial0/0/0] link-protocol fr
[labnario1-Serial0/0/0] fr map ip 123.100.1.2 102 broadcast
[labnario1-Serial0/0/0] fr map ip 123.100.1.3 103 broadcast
[labnario1-Serial0/0/0] ip address 123.100.1.1 255.255.255.0
This is a physical interface which acts as a multipoint interface. All IP to DLCI mappings as well as IP address configuration, should be done under a physical serial interface. Broadcast option at the end of DLCI mapping statement should be added, if we want to send multicast or broadcast packets over this interface. This is required especially, when we are planning to use a dynamic routing protocol over this interface.
Now I want to configure labnario2 router. I will use a logical p2p subinterface.
[labnario2]interface Serial0/0/0
[labnario2-Serial0/0/0] link-protocol fr
[labnario2-Serial0/0/0] interface Serial0/0/0.201 p2p
[labnario2-Serial0/0/0.201] fr dlci 201
[labnario2-fr-dlci-Serial0/0/0.201-201] ip address 123.100.1.2 255.255.255.0
As you can see, there is no fr map ip statement under a point-to-point subinterface. We do not need it, because only one PVC can be assigned to this type of subinterface. All packets with a destination IP address from the range of 123.100.1.0/24, will be routed through this PVC.
On the labnario3 router I will use a logical p2mp subinterface.
[labnario3]interface Serial0/0/0
[labnario3-Serial0/0/0] link-protocol fr
[labnario3-Serial0/0/0] interface Serial0/0/0.301
[labnario3-Serial0/0/0.301] fr map ip 123.100.1.1 301 broadcast
[labnario3-Serial0/0/0.301] fr map ip 123.100.1.2 301 broadcast
[labnario3-Serial0/0/0.301] ip address 123.100.1.3 255.255.255.0
Logical point-2-multipoint frame relay interface configuration is similar to physical interface, as both are multipoint. The only difference is that DLCI to IP mappings and IP address should be configured under a logical serial subinterface not under a physical serial interface.
How to verify if our frame relay interface is working correctly?
First I want to check connectivity between routers.
<labnario1>ping 123.100.1.2
  PING 123.100.1.2: 56  data bytes, press CTRL_C to break
    Reply from 123.100.1.2: bytes=56 Sequence=1 ttl=255 time=90 ms
    Reply from 123.100.1.2: bytes=56 Sequence=2 ttl=255 time=80 ms
    Reply from 123.100.1.2: bytes=56 Sequence=3 ttl=255 time=70 ms
    Reply from 123.100.1.2: bytes=56 Sequence=4 ttl=255 time=70 ms
    Reply from 123.100.1.2: bytes=56 Sequence=5 ttl=255 time=70 ms
<output ommited>

<labnario1>ping 123.100.1.3
  PING 123.100.1.3: 56  data bytes, press CTRL_C to break
    Reply from 123.100.1.3: bytes=56 Sequence=1 ttl=255 time=80 ms
    Reply from 123.100.1.3: bytes=56 Sequence=2 ttl=255 time=50 ms
    Reply from 123.100.1.3: bytes=56 Sequence=3 ttl=255 time=90 ms
    Reply from 123.100.1.3: bytes=56 Sequence=4 ttl=255 time=70 ms
    Reply from 123.100.1.3: bytes=56 Sequence=5 ttl=255 time=30 ms
<output ommited>

<labnario1>ping 123.100.1.3
  PING 123.100.1.3: 56  data bytes, press CTRL_C to break
    Reply from 123.100.1.3: bytes=56 Sequence=1 ttl=255 time=85 ms
    Reply from 123.100.1.3: bytes=56 Sequence=2 ttl=255 time=50 ms
    Reply from 123.100.1.3: bytes=56 Sequence=3 ttl=255 time=90 ms
    Reply from 123.100.1.3: bytes=56 Sequence=4 ttl=255 time=70 ms
    Reply from 123.100.1.3: bytes=56 Sequence=5 ttl=255 time=30 ms
<output ommited>
Labnario1 uses a physical frame relay interface. Below are some useful troubleshooting commands:
[labnario1]dis fr int s0/0/0
Serial0/0/0, DTE, physical up, protocol up
This is a DTE side, frame relay switch acts as a DCE.
To verify frame relay mappings configuration:
[labnario1]display fr map-info
Map Statistics for interface Serial0/0/0 (DTE)
  DLCI = 102, IP 123.100.1.2, Serial0/0/0
    create time = 2012/12/13 11:41:12, status = ACTIVE
    encapsulation = ietf, vlink = 683, broadcast
  DLCI = 103, IP 123.100.1.3, Serial0/0/0
    create time = 2012/12/13 11:41:12, status = ACTIVE
    encapsulation = ietf, vlink = 684, broadcast
For PVC status verification, use:
[labnario1]display fr pvc-info
PVC statistics for interface Serial0/0/0 (DTE, physical DOWN)
  DLCI = 102, USAGE = LOCAL (00000100), Serial0/0/0
    create time = 2012/12/13 11:41:12, status = ACTIVE
    InARP = Enable
    in BECN = 0, in FECN = 0
    in packets = 424, in bytes = 13474
    out packets = 446, out bytes = 14108
  DLCI = 103, USAGE = LOCAL (00000100), Serial0/0/0
    create time = 2012/12/13 11:41:12, status = ACTIVE
    InARP = Enable
    in BECN = 0, in FECN = 0
    in packets = 303, in bytes = 9438
    out packets = 525, out bytes = 16244
The same commands on labnario2:
[labnario2]dis fr interface s0/0/0.201
Serial0/0/0.201, point-to-point, DTE, physical up, protocol up

[labnario2]dis fr map-info
Map Statistics for interface Serial0/0/0 (DTE)
  DLCI = 201, Point-to-Point DLCI, Serial0/0/0.201
    create time = 2012/12/13 11:41:15, status = ACTIVE

[labnario2]dis fr pvc-info
PVC statistics for interface Serial0/0/0 (DTE, physical UP)
  DLCI = 201, USAGE = LOCAL (00000010), Serial0/0/0.201
    create time = 2012/12/13 11:41:15, status = ACTIVE
    InARP = Enable
    in BECN = 0, in FECN = 0
    in packets = 780, in bytes = 24128
    out packets = 781, out bytes = 24300
Labnario3 verification:
[labnario3]dis fr int s0/0/0.301
Serial0/0/0.301, multi-point, DTE, physical up, protocol up

[labnario3]dis fr map-info
Map Statistics for interface Serial0/0/0 (DTE)
  DLCI = 301, IP 123.100.1.1, Serial0/0/0.301
    create time = 2012/12/13 11:41:15, status = ACTIVE
    encapsulation = ietf, vlink = 7, broadcast
  DLCI = 301, IP 123.100.1.2, Serial0/0/0.301
    create time = 2012/12/13 11:41:15, status = ACTIVE
    encapsulation = ietf, vlink = 8, broadcast

[labnario3]dis fr pvc-info
PVC statistics for interface Serial0/0/0 (DTE, physical UP)
  DLCI = 301, USAGE = LOCAL (00000100), Serial0/0/0.301
    create time = 2012/12/13 11:41:15, status = ACTIVE
    InARP = Enable
    in BECN = 0, in FECN = 0
    in packets = 918, in bytes = 28034
    out packets = 970, out bytes = 29564
Some debugging commands:
<labnario2>debugging fr ?
  all          All debugging functions
  compression  FR compression
  event        Event debugging functions
  inarp        INARP debugging functions
  ipc          IPC/RPC debugging functions
  lmi          LMI debugging functions
  mfr          Multilink FR debugging
  packet       Packet debugging functions
Read More »