Virtual Router Redundancy Protocol (VRRP) combines a group of routing devices on a LAN into a backup group that functions as a virtual router. From the host perspective in the LAN, it only needs the IP address of the virtual router rather than the IP address of a specific device in the backup group. Virtual IP address must be set as a default gateway for the host in the LAN. VRRP dynamically associates the virtual router with a physical device that transmits services. When the device fails, the second device is selected to handover traffic. The switchover should be transparent to users, allowing the internal and external networks to communicate without interruption. It, of course, depends on configured services. Most sensitive services need higher reliability and VRRP itself is not enough. But I will mention about it later in the post.
Let’s switch from theory to more practical things.
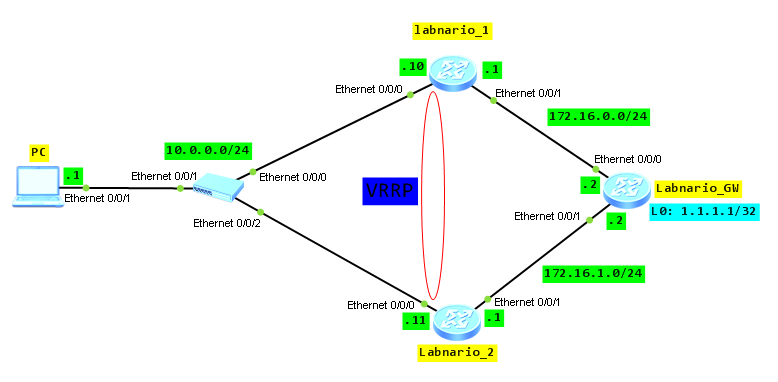
VRRP topology:
Assure communication between all elements in the network. It is omitted here.
Configure VRRP on labnario_1 and labnario_2. Set VRRP priority to 120 for labnario_1:
[labnario_1]interface Vlanif 100
[labnario_1-Vlanif100]ip address 10.0.0.10 255.255.255.0
[labnario_1-Vlanif100]vrrp vrid 100 virtual-ip 10.0.0.254
[labnario_1-Vlanif100]vrrp vrid 100 priority 120

[labnario_2]interface Vlanif 100
[labnario_2-Vlanif100]ip add 10.0.0.11 255.255.255.0
[labnario_2-Vlanif100]vrrp vrid 100 virtual-ip 10.0.0.254

[labnario_1]display vrrp brief
VRID  State        Interface                Type     Virtual IP
----------------------------------------------------------------
100   Master       Vlanif100                Normal   10.0.0.254
----------------------------------------------------------------
Total:1     Master:1     Backup:0     Non-active:0

[labnario_2]display vrrp brief
VRID  State        Interface                Type     Virtual IP
----------------------------------------------------------------
100   Backup       Vlanif100                Normal   10.0.0.254
----------------------------------------------------------------
Total:1     Master:0     Backup:1     Non-active:0
Now we can check how traffic is going through our network:
PC>tracert 1.1.1.1
traceroute to 1.1.1.1, 8 hops max
(ICMP), press Ctrl+C to stop
 1  10.0.0.10   16 ms  ping 1.1.1.1 -t
Ping 1.1.1.1: 32 data bytes, Press Ctrl_C to break
From 1.1.1.1: bytes=32 seq=1 ttl=254 time=62 ms
From 1.1.1.1: bytes=32 seq=2 ttl=254 time=47 ms
From 1.1.1.1: bytes=32 seq=3 ttl=254 time=140 ms
From 1.1.1.1: bytes=32 seq=4 ttl=254 time=31 ms
--- 1.1.1.1 ping statistics ---
  4 packet(s) transmitted
  4 packet(s) received
  0.00% packet loss
  round-trip min/avg/max = 31/70/140 ms
As we can see traffic is going through labnario_1, what confirms that VRRP is working in a proper way. Only Master can forward traffic to labnario_GW.
Let’s look at output of display vrrp command on both routers:
[labnario_1]display vrrp
  Vlanif100 | Virtual Router 100
    State : Master
    Virtual IP : 10.0.0.254
    Master IP : 10.0.0.10
    PriorityRun : 120
    PriorityConfig : 120
    MasterPriority : 120
    Preempt : YES   Delay Time : 0 s
    TimerRun : 1 s
    TimerConfig : 1 s
    Auth type : NONE
    Virtual MAC : 0000-5e00-0164
    Check TTL : YES
    Config type : normal-vrrp
    Create time : 2013-01-22 12:35:04 UTC-08:00
    Last change time : 2013-01-22 12:42:53 UTC-08:00

[labnario_2]display vrrp
  Vlanif100 | Virtual Router 100
    State : Backup
    Virtual IP : 10.0.0.254
    Master IP : 10.0.0.10
    PriorityRun : 100
    PriorityConfig : 100
    MasterPriority : 120
    Preempt : YES   Delay Time : 0 s
    TimerRun : 1 s
    TimerConfig : 1 s
    Auth type : NONE
    Virtual MAC : 0000-5e00-0164
    Check TTL : YES
    Config type : normal-vrrp
    Create time : 2013-01-22 12:35:32 UTC-08:00
    Last change time : 2013-01-22 12:42:53 UTC-08:00
Router labnario_1 is Master in VRRP group and it forwards traffic. Its config and running priority is 120. VRRP priority for labnario_2 is 100 by default.
Let’s simulate 2 cases:
- Labnario_1 is broken. We can simulate it by making interface VlanIf100 DOWN.
- Failure in LAN network by making interface Eth0/0/0 DOWN.
I was thinking how to show you that VRRP is working properly. Please look at this link. You will find exe file there with this simulation. You do not have to install anything. Just open the file. I did like that because WordPress does not allow to add such files directly.
VRRP switchover simulation
In both cases labnario_1 is initialize state. It means that there is no connection between VRRP routers. Labnario_2 is now Master in VRRP group.
What will happen if interface Ethernet0/0/1 goes into DOWN state?
Let’s shutdown interface Ethernet0/0/1 of labnario_1:
PC>tracert 1.1.1.1
traceroute to 1.1.1.1, 8 hops max
(ICMP), press Ctrl+C to stop
 1  10.0.0.10   15 ms  16 ms  31 ms
 2  10.0.0.11   31 ms  32 ms  15 ms
 3  1.1.1.1   63 ms  46 ms  47 ms
Traffic is still directed to labnario_1, which is VRRP Master. There is no VRRP switchover because Ethernet0/0/1 is not in the LAN.
We can avoid such situation by tracking interface Ethernet 0/0/1 in VRRP of labnario_1 router. In case of Eth0/0/1 failure, switchover will be performed between labnario_1 and labnario_2 and labnario_2 will become VRRP Master. VRRP priority of labnario_2 will be reduced to 80.
Let’s configure interface tracking:
[labnario_1]int Vlanif  100
[labnario_1-Vlanif100]vrrp vrid 100 track interface Ethernet 0/0/1 reduced 40

[labnario_1]dis vrrp
  Vlanif100 | Virtual Router 100
    State : Master
    Virtual IP : 10.0.0.254
    Master IP : 10.0.0.10
    PriorityRun : 120
    PriorityConfig : 120
    MasterPriority : 120
    Preempt : YES   Delay Time : 0 s
    TimerRun : 1 s
    TimerConfig : 1 s
    Auth type : NONE
    Virtual MAC : 0000-5e00-0164
    Check TTL : YES
    Config type : normal-vrrp
    Track IF : Ethernet0/0/1   Priority reduced : 40
    IF state : UP
    Create time : 2013-01-22 12:35:04 UTC-08:00
    Last change time : 2013-01-22 13:46:34 UTC-08:00
Let’s shutdown interface Eth0/0/1 once again and check what will happen:
[labnario_1-Ethernet0/0/1]shutdown

[labnario_1-Ethernet0/0/1]dis vrrp
  Vlanif100 | Virtual Router 100
    State : Backup
    Virtual IP : 10.0.0.254
    Master IP : 10.0.0.11
    PriorityRun : 80
    PriorityConfig : 120
    MasterPriority : 100
    Preempt : YES   Delay Time : 0 s
    TimerRun : 1 s
    TimerConfig : 1 s
    Auth type : NONE
    Virtual MAC : 0000-5e00-0164
    Check TTL : YES
    Config type : normal-vrrp
    Track IF : Ethernet0/0/1   Priority reduced : 40
    IF state : DOWN
    Create time : 2013-01-22 12:35:04 UTC-08:00
    Last change time : 2013-01-22 14:17:44 UTC-08:00

[labnario_2]dis vrrp
  Vlanif100 | Virtual Router 100
    State : Master
    Virtual IP : 10.0.0.254
    Master IP : 10.0.0.11
    PriorityRun : 100
    PriorityConfig : 100
    MasterPriority : 100
    Preempt : YES   Delay Time : 0 s
    TimerRun : 1 s
    TimerConfig : 1 s
    Auth type : NONE
    Virtual MAC : 0000-5e00-0164
    Check TTL : YES
    Config type : normal-vrrp
    Create time : 2013-01-22 12:35:32 UTC-08:00
    Last change time : 2013-01-22 14:17:45 UTC-08:00
How to make VRRP switchover faster?
You can configure BFD session between VRRP routers (on both routers) and track this BFD session in VRRP labnario_2 router. If LAN connection between both routers fails, BFD session will go DOWN, what will trigger VRRP switchover in milliseconds.
[labnario_1]bfd VRRP_test bind peer-ip 10.0.0.11 interface Vlanif 100
[labnario_1-bfd-session-VRRP_test]discriminator local 1
[labnario_1-bfd-session-VRRP_test]discriminator remote 2
[labnario_1-bfd-session-VRRP_test]commit

[labnario_2]bfd VRRP_test bind peer-ip 10.0.0.10 interface Vlanif 100
[labnario_2-bfd-session-VRRP_test]discriminator local 2
[labnario_2-bfd-session-VRRP_test]discriminator remote 1
[labnario_2-bfd-session-VRRP_test]commit

[labnario_2]dis bfd ses all
--------------------------------------------------------------------------------

Local Remote     PeerIpAddr      State     Type        InterfaceName

--------------------------------------------------------------------------------
2     1          10.0.0.10       Up        S_IP_IF     Vlanif100

--------------------------------------------------------------------------------

     Total UP/DOWN Session Number : 1/0

[labnario_2-Vlanif100]vrrp vrid 100 track bfd-session 2 increased 40
In case of LAN connection failure between both routers, VRRP priority of labnario_2 will increase to 140 and labnario_2 will become Master in VRRP group.
To assure communication between routers in VRRP group, it is recommended to add direct L2 connection between them. In practice we can use trunk or Eth-trunk interfaces. How to configure Eth-trunk interfaces you can find in link aggregation (EEE802.3ad) on Huawei S5700.
In case of Ethernet 0/0/0 of labnario_1 failure, labnario_1 keeps to be Master, because connection between VRRP routers is assured and traffic is going to labnario_2 and then to labnario_1 by Eth-trunk links.
Final configs:
sysname labnario_1
#
vlan batch 100
#
bfd
#
interface Vlanif100
 ip address 10.0.0.10 255.255.255.0
 vrrp vrid 100 virtual-ip 10.0.0.254
 vrrp vrid 100 priority 120
 vrrp vrid 100 track interface Ethernet0/0/1 reduced 40
#
interface Ethernet0/0/0
 portswitch
 port link-type access
 port default vlan 100
#
interface Ethernet0/0/1
 ip address 172.16.0.1 255.255.255.0
#
bfd VRRP_test bind peer-ip 10.0.0.11 interface Vlanif100
 discriminator local 1
 discriminator remote 2
 commit
#
ospf 1
 area 0.0.0.0
  network 10.0.0.0 0.0.0.255
  network 172.16.0.0 0.0.0.255

sysname labnario_2
#
vlan batch 100
#
bfd
#
interface Vlanif100
 ip address 10.0.0.11 255.255.255.0
 vrrp vrid 100 virtual-ip 10.0.0.254
 vrrp vrid 100 track bfd-session 2
#
interface Ethernet0/0/0
 portswitch
 port hybrid pvid vlan 100
#
interface Ethernet0/0/1
 ip address 172.16.1.1 255.255.255.0
#
bfd VRRP_test bind peer-ip 10.0.0.10 interface Vlanif100
 discriminator local 2
 discriminator remote 1
 commit
#
ospf 1
 area 0.0.0.0
  network 10.0.0.0 0.0.0.255
  network 172.16.1.0 0.0.0.255

sysname labnario_GW
#
interface Ethernet0/0/0
 ip address 172.16.0.2 255.255.255.0
#
interface Ethernet0/0/1
 ip address 172.16.1.2 255.255.255.0
#
interface LoopBack0
 ip address 1.1.1.1 255.255.255.255
#
ospf 1
 area 0.0.0.0
  network 1.1.1.1 0.0.0.0
  network 172.16.0.0 0.0.0.255
  network 172.16.1.0 0.0.0.255
Read More »